Comparing Cost of Living – Before You Call the Moving Truck

Comparing Cost of Living - Before You Call the Moving Truck

Have you ever considered moving somewhere new but didn’t know if you could afford to live there?  With the right data compiled into a comparison tool, you can.  

The Cost-of-Living Index compares the cost of living in one city/region versus another to help job seekers, researchers, organizations like the EDC, and site selectors. The Index has been published by the Council for Community and Economic Research (C2ER) since 1968 with data recognized by the U.S. Census Bureau, U.S. Bureau of Labor Statistics, and CNN Money, just to name a few.  

Participants (in our region, it is the Greater Fargo Moorhead EDC) gather pricing information for more than 60 commonly used goods and services. Each organization submits the prices and C2ER analyzes and publishes a quarterly index of this information. Pricing information is gathered on housing costs, groceries, specific clothing items, entertainment, utilities and more to understand how prices are changing in real-time and how they compare against other metros.

Knowing where a dollar goes the furthest helps residents find the best place to call home and businesses relocate to fit the needs of its employees,” said Tyler Baines, COLI Project Manager/Research Analyst for C2ER. 

How is it used?

It’s a tool used to compare different region’s costs against one another and against a national average.  

The average for all participating places is equal to 100, and we read the index as a percentage of the average. For example, Manhattan, NY’s 2023 first quarter Index is 222.0. Compared to Fargo-Moorhead MSA’s index of 97.9, it’s more than twice as expensive to live in Manhattan. Another reason to love the Fargo-Moorhead Region!  

We use Cost of Living information at the GFMEDC to help tell the story about how our economy stacks up against others. For example, since our index is below the national average, we can use this messaging to help attract projects to our area by including this in our proposals and share in our workforce recruitment marketing. 

Below are some additional index comparisons from Quarter 1 2023 that were released by C2ER.  

Interested in learning more about how to interpret the index? Here’s the fine print.

The most recent data may surprise you.

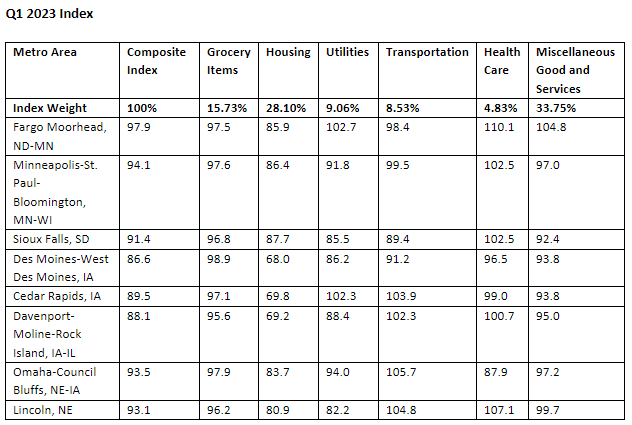
In looking at the data for Q1 2023, Fargo’s Cost of Living Index score (97.9) is higher than Minneapolis’ (94.1) and the other comparison metros.

What does this mean?  

It means you may have to dig deeper into the data. For example, we can see that one third of the index composite is attributed to miscellaneous goods and services, and when you dig into that category you find items such as eating out, entertainment, beauty services, etc.

If individuals and families limit these expenses, then it is easy to see we are competitive in the other two highest weighted categories – groceries and housing. 

Speaking of housing, the index shows us competitive with most of the other Midwest metros outside of the Iowa metros. In talking with COLI staff, what isn’t included in this calculation are the special assessments our region has that others do not. We are working with COLI staff to determine the best way to capture these costs, which in some cases can be at least 15% of the home cost. 

In addition, after checking with C2ER, we were informed that percentage differences of just a few points are not considered significantly different, and changes of more than 10% tend to indicate more variance.

We will continue to monitor additional publications for changes that denote significance in the data. As we continue our participation in price collection, we’ll update (via the newsletter) new pricing information for the Fargo Moorhead metro. 

What are we keeping an eye on?

As data is analyzed and released for the second quarter (available late August or early September), we keep an eye on how the index fluctuates for our metro as well as metros we are often compared to. 

Special Note

You may be familiar with our economic indicators published monthly on our website. The Cost of Living Index provided in our Economic Indicators is also sourced from C2ER but is at the county level and is not the same as the participant-sourced data collected. The two data sets have strong positive correlation, but the county data is dependent on the metro-level quarterly dataset, among other variables.

Cost of Living Calculator

Greater FM Data sponsored by

Latest Article
Connect With Us

Related Article